|
The Biostatistics app
provides descriptive statistics and statistical tests and procedures
of interest primarily to students and researchers in the life
sciences. The provided tests and procedures may also prove useful
to those in other fields who draw inferences about large populations
from measurements taken from random samples. The Biostatistics
app runs on the Apple™ iPad™ and is available for purchase
in the Apple App Store℠.
Tests and Procedures
The Biostatistics app
currently provides the the following tests and procedures:
for interval data (normally distributed
populations)
- t test
- analysis of variance (ANOVA)
- paired t test
- repeated measures ANOVA
- linear regression and correlation
for nominal data
- chi-square (χ²)
- McNemar test
- Cochran Q test
- relative risk
- odds ratio
for ordinal data (and interval
data from populations not known to be normally distributed)
- Mann-Whitney rank-sum test
- Kruskal-Wallis test
- Wilcoxon rank-sum test
- Friedman test
- Spearman rank correlation
for survival time data
- Kaplan-Meier survival curves
- log rank test
- Gehan test
How to Use Biostatistics
Choosing
the Appropriate Test or Procedure
When the user taps the Biostatistics
app icon for the first time, the app opens on the home page.
One may access all of the app’s tests and procedures by tapping
the “raw data” button or the “n-mean-SD”
button the on the left side of the main page’s navigation
bar. The “raw data” button presents procedure tools that accept actual
experimental data. The “n-mean-SD”
button presents procedure tools that accept summary data: the number of
subjects, the mean, and the standard deviation.
The currently implemented tests and procedures are listed
in the drop-down menus in alphabetical order. Touching any item
in the list causes the app to open the appropriate tool to collect
the data in order to perform the chosen procedure. This tool
is either a spreadsheet or a data entry form.

Most of the main page consists of a table of labels intended
to help the user choose the procedure that is appropriate for
the experiment, given the nature of the data to be collected
and the protocol to be followed. Along the left margin are headings
for the four types of data typically collected in biological
and medical research: interval, nominal, ordinal, and survival-time. You can access
the labels relevant to a particular type of data by tapping the data type’s
label. Along the top margin are headings for five types of research
protocols commonly followed in biological and medical research:
before-and-after measurements
of the same group of subjects, multiple measurements of the same
group of subjects, measurement
of members of two different groups, measurement of members of
more than two different groups, and measurements of two parameters on each
subject in a group for the purpose of detecting trends (e.g., Is a subject’s blood
pressure likely to be higher if his body mass index is higher?).
You can also access the relevant labels by sliding the horizontal and
vertical bars so that they are positioned below or adjacent to the
appropriate labels.
Double-tapping the procedure label that corresponds to the type of data to be
collected and the type of protocol to be applied causes the app
to open the appropriate data-collection tool for the procedure
applicable to the experiment.

Entering
the Data
For procedures that utilize a spreadsheet for data entry (e.g., the t test), the spreadsheet
will display one or more cells in which the user can enter data.
The user enters data by tapping one of the cells. When he does
so, a number pad appears. The user enters the data for the cell
in question by tapping the buttons on the number pad.

In addition to the digits 0 through 9, the number pad displays
various non-numeric keys. The keys appearing on the number pad
depend on the nature of the data that can appear in the spreadsheet.
For procedures that use data in the form of positive or negative
floating-point numbers, the number pads non-numeric keys include
a decimal point button, a negative sign button, and an exponent
button. One may enter floating-point numbers either in traditional
floating-point form (e.g.,
123.45) or in scientific notation (e.g.,
1.2345e+2). To clear the number pads number field, tap
the Clear button. To delete that number already contained in
a cell, leaving the cell empty, tap the Delete button. Tapping
the Done button will transfer the number from the number pad
to the cell.

When you choose a procedure that utilizes a spreadsheet for
data entry, the spreadsheet’s toolbar will identify the chosen
procedure and will assign a name to the data set based on the
current date and time. The user may change the name of the data
set by tapping the name on the toolbar and entering a new name
using the keyboard that appears. To return to the main page,
tap the back button.
To clear all the data in a spreadsheet, tap the reset button  at the top of the spreadsheet. at the top of the spreadsheet.
To paste data into a spreadsheet, tap the paste button
 at the top of the spreadsheet. The app does not have a copy
button because the Apple iOS spreadsheet app, Numbers, uses some
sort of proprietary clipboard format and pastes an entire
Biostatistics spreadsheet into a single cell. To open a
data set in Numbers, email it to yourself, tap the attachment to
the email, and iOS will give you the option to open it in any
installed iPad app that reads CSV files.
You can create a spreadsheet using the Apple Numbers
app, copy the data onto the clipboard, and paste the data into
a Biostatistics spreadsheet.
One should be aware, however, of one limitations of the paste feature:
Biostatistics does not know
if the data pasted into a spreadsheet is appropriate for the
kind of procedure being run. at the top of the spreadsheet. The app does not have a copy
button because the Apple iOS spreadsheet app, Numbers, uses some
sort of proprietary clipboard format and pastes an entire
Biostatistics spreadsheet into a single cell. To open a
data set in Numbers, email it to yourself, tap the attachment to
the email, and iOS will give you the option to open it in any
installed iPad app that reads CSV files.
You can create a spreadsheet using the Apple Numbers
app, copy the data onto the clipboard, and paste the data into
a Biostatistics spreadsheet.
One should be aware, however, of one limitations of the paste feature:
Biostatistics does not know
if the data pasted into a spreadsheet is appropriate for the
kind of procedure being run.
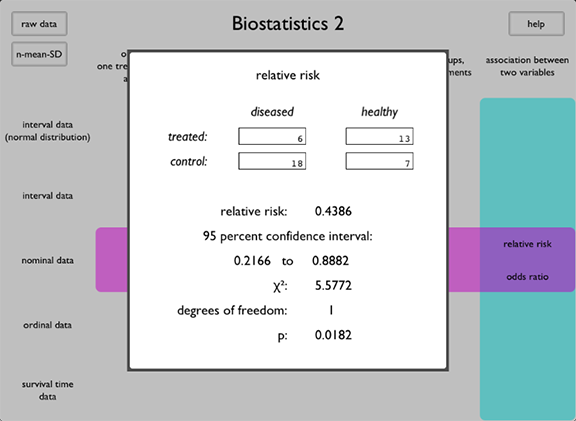
For procedures that utilize a form for data entry (relative risk and odds ratio), the
displayed form will contain labelled cells in which the user
can enter the appropriate data using the same number pad. When
the user has entered data for each cell, the form will automatically
display the relevant statistics in fields contained within the
form. No further
action is required to generate the desired statistics once the
user has filled in all the fields on the form.
Generating
a Report
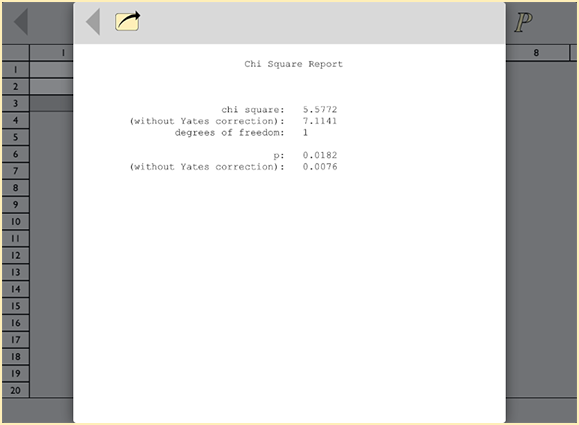
For procedures
that utilize a spreadsheet, the user must tap the
compute button  on the upper, right side of the screen
in order to compute the desired statistics. When he does
so, a report will appear. The action button
gives the user the option to email a pdf version of the
report or to save it in a Dropbox folder.
(Look for “/apps/Biostatistics 2” in your Dropbox folder.)
These actions facilitate
printing the report on any printer connected
to the recipient’s computer. To close the report,
tap the back button on the upper, left corner of the report. on the upper, right side of the screen
in order to compute the desired statistics. When he does
so, a report will appear. The action button
gives the user the option to email a pdf version of the
report or to save it in a Dropbox folder.
(Look for “/apps/Biostatistics 2” in your Dropbox folder.)
These actions facilitate
printing the report on any printer connected
to the recipient’s computer. To close the report,
tap the back button on the upper, left corner of the report.
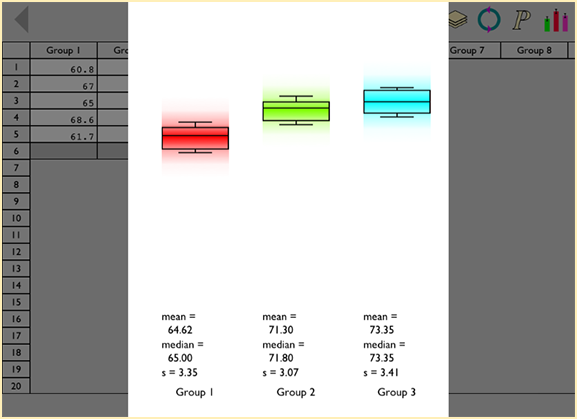
Displaying Data Graphically
If the procedure you are using provides a graphical display of your data,
you will see a graphics button  in the upper, right
corner of the screen. Tapping the graphics button reveals the groups of data displayed
graphically. For most of the procedures, the graphics page will show a box plot
superimposed on a color bar centered on the group’s mean and extending three
standard deviations in both directions. in the upper, right
corner of the screen. Tapping the graphics button reveals the groups of data displayed
graphically. For most of the procedures, the graphics page will show a box plot
superimposed on a color bar centered on the group’s mean and extending three
standard deviations in both directions.
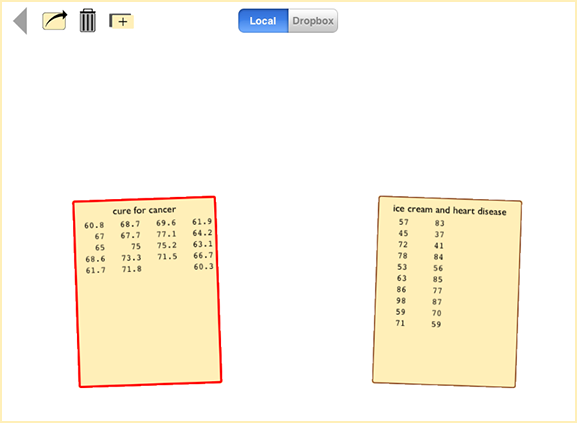
Data Sets
When the user taps the data sets button  at the top
of a spreadsheet, the user will see a stack
of all the data sets on the device. One may load the data
from a data set item by double-tapping it.
If you tap a data set item once,
you select it, and three buttons will appear at the top of the screen. The
copy button at the top
of a spreadsheet, the user will see a stack
of all the data sets on the device. One may load the data
from a data set item by double-tapping it.
If you tap a data set item once,
you select it, and three buttons will appear at the top of the screen. The
copy button  copies the data set. The delete button copies the data set. The delete button
 deletes the data set. The action button deletes the data set. The action button
 gives you the choice to email the
data set or to save it in a Dropbox folder. The data set will be attached to the
email or saved in your Dropbox folder as an “comma-separated-values” (CSV) file,
which you can open in any spreadsheet program or text editor. You can flip through
the stack of data sets by flicking the top card in the stack to the right to
reveal the cards underneath it. gives you the choice to email the
data set or to save it in a Dropbox folder. The data set will be attached to the
email or saved in your Dropbox folder as an “comma-separated-values” (CSV) file,
which you can open in any spreadsheet program or text editor. You can flip through
the stack of data sets by flicking the top card in the stack to the right to
reveal the cards underneath it.
To return to the spreadsheet, tap the back button.
Feedback
Feedback on the Biostatistics
app is welcome. One can send email by clicking . You may also send feedback from within the app
itself. On the main page tap the help button in the upper, right
corner select “send feedback”.
Version History
Version 1.001
corrected multiple popover and action sheet bugs.
Version 1.002
enabled copying and pasting data between Biostatistics
spreadsheets and between Biostatistics and other iPad
applications and made minor changes to bolster the application's
stability.
Version 1.003
was recompiled against iOS 4.3.2 in the hope of eliminating an
obscure bug that caused the app to crash on some iPads after
updating to iOS 4.3.2. Also, Version 1.003 modifies the chi-square
report for 2 x 2 arrays to show chi-square and p values with
and without the Yates correction. Finally, Version 1.003 enables
data set sharing though iTunes in the full version of the app.
Version 2.0
entailed a complete rewrite of the app in Objective-C. (Previous
versions were written in C# using MonoTouch.) Version 2.0 adds
graphics for most of the procedures and multiple comparison procedures
for the analysis of variance and similar tests.
Version 2.0.1
fixed a minor bug.
|